
Bar graph is the way of re presenting data using rectangular bars.
Eg. The given table shows the data collected from grade 3. Represent it in bar graph.
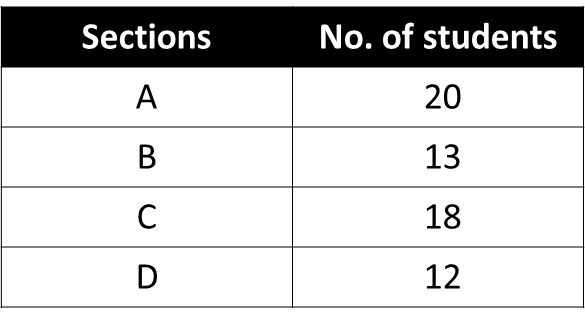
Ans.

Bar graph is the way of re presenting data using rectangular bars.
Eg. The given table shows the data collected from grade 3. Represent it in bar graph.
Ans.
